
Go to Market Engineering: What It Is and How It Works
Go to market engineering explained: the core capabilities, the systems behind them, and how they tie technical infrastructure to revenue execution.

The quarter closes in nine days. Pipeline coverage looks healthy, three deals are marked commit, and the forecast call is an hour of people defending their numbers instead of fixing anything. Two of the three commit deals slip, the enterprise account that cleared security review goes quiet, and nobody can point to the week it went wrong.
Marketing says the leads were there. Sales says half of them were never real. The CRM carries 14 stages because three sales leaders added their own, and the dashboard everyone was told to trust was built by someone who left eight months ago.
None of that is a motivation problem. It's a design problem, and the discipline that fixes it has a name.
Table of Contents
- What Go to Market Engineering Actually Means
- Core Capabilities Behind a GTM Engineering Function
- How Systems Connect Technical Infrastructure to Revenue
- Where Human Judgment Must Stay in Automated Revenue Work
- Go to Market Engineering in Practice
- Metrics That Show Whether the System Works
- Confirm Your Starting Point Before You Build
What Go to Market Engineering Actually Means
Go to market engineering is the practice of designing revenue execution as an instrumented system, one where the stages, data, handoffs, tools and feedback loops that carry a buyer from first signal to renewal are specified, owned and measured.
Working definition: go to market engineering treats revenue execution as a delivery system. Every stage has an entry rule, every handoff has an owner, every transition produces a timestamped event, and every change gets judged on downstream revenue rather than on how busy the team looks.
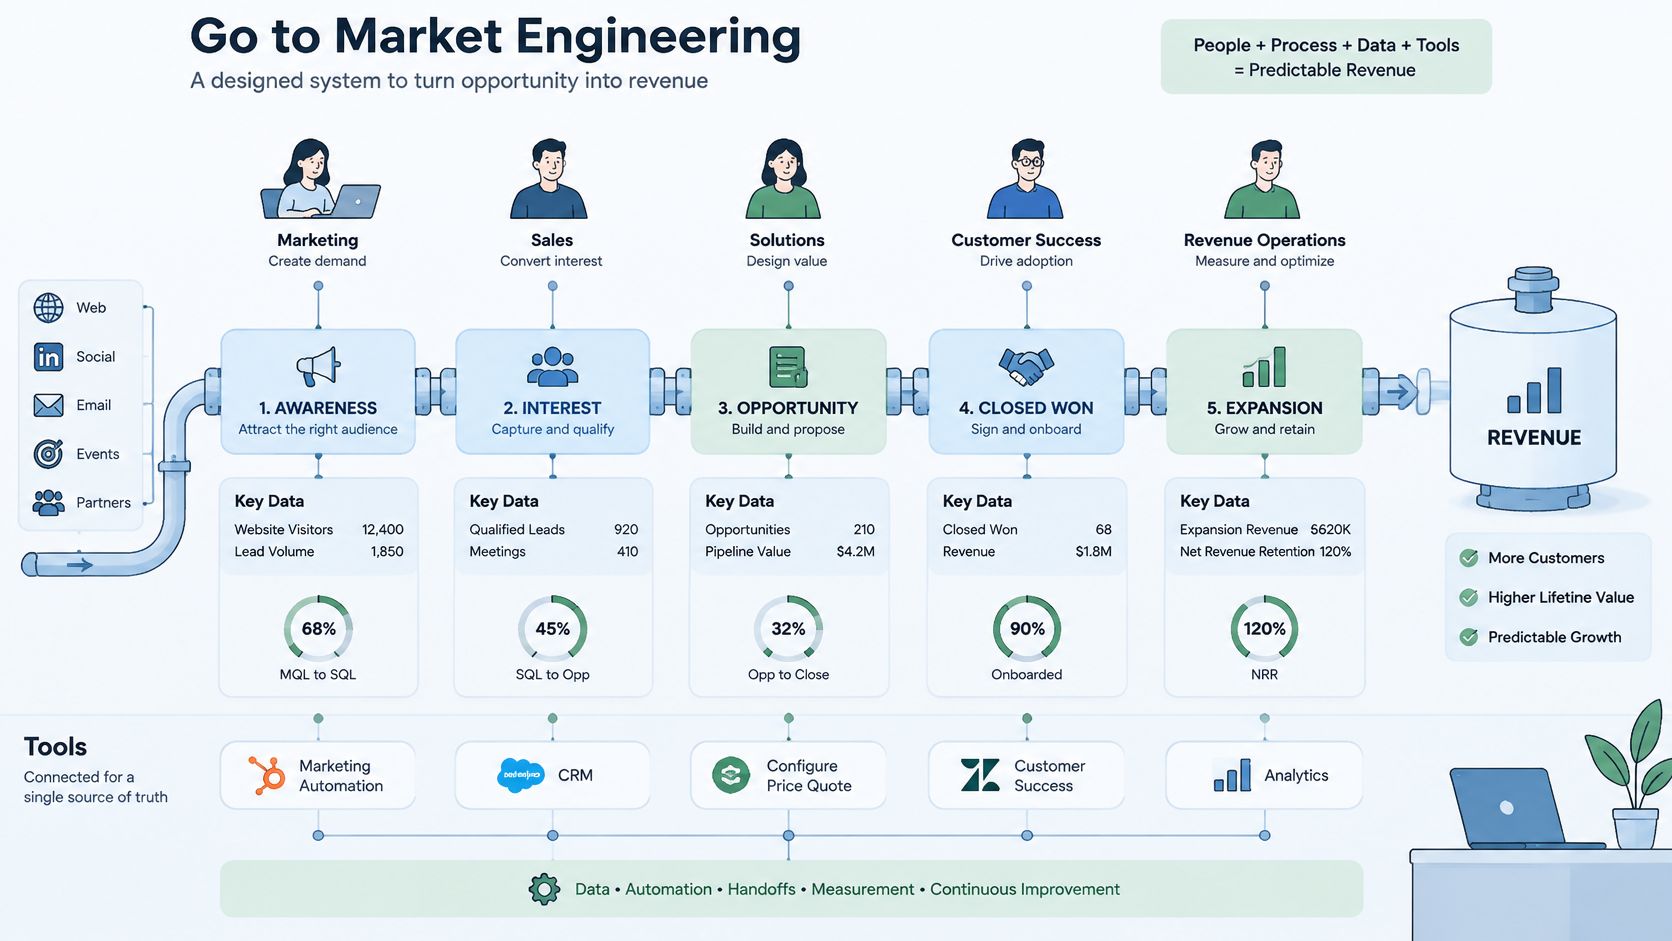
The definition is deliberately unglamorous. It says almost nothing about tools. What it insists on is specification, ownership and measurement, the three things missing in most revenue organizations that describe themselves as data-driven.
Picture the machinery in good order. Reps are dialing, sequences are sending, inbound is answered, and the pipeline report shows more coverage than the target requires. Then the quarter lands short and the post-mortem produces adjectives instead of causes: the leads were soft, the price was high, the champion went quiet. A factory with working machines and no wiring diagram behaves exactly like this. Each line runs, output falls, and nobody can trace which connection failed.
Where it sits between teams
The work sits between marketing, sales, customer success, data and revenue operations rather than inside any one of them. Revenue operations usually owns reporting and process discipline. Sales engineering supports individual technical deals. Go to market engineering owns the connected system in between: the definitions, the data contracts, the routing logic and the feedback loop that tells everyone whether the pipeline is producing revenue or just producing activity.
The coordination burden grew because buying changed. McKinsey reported that B2B customers used an average of 10 interaction channels in 2021, up from 5 in 2016, spanning video conferencing, websites, email, mobile apps, e-procurement portals and online chat alongside the in-person rep (McKinsey B2B omnichannel research). In a separate McKinsey survey of more than 1,000 B2B buyers across four countries, 76% said speaking with a salesperson was helpful when researching a new product or service, while only 15% wanted sales involvement when repurchasing the exact same product. The same study found 46% of buyers were willing to purchase through a supplier website if the option were available and efficient, against 10% who were buying online at the time.
Those figures rule out the lazy version of the argument, which says the choice is sales-led or digital. The requirement is different human and digital treatment for different buying stages, with one consistent set of definitions underneath. Positioning comes before any of that wiring is worth doing, because instruments on a muddled offer just measure confusion faster. If the message and launch sequence are still unsettled, launch strategy tips from FOMOchat are a sensible place to start before you build anything downstream of them.
Here's the test that tells you whether the discipline is needed now. Pick a closed-lost deal from last quarter and trace it end to end: first touch, the stage names it passed through, the owner at each handoff, the definition of qualified it satisfied, and the point where it stalled. If two people give you two different answers, you don't have a revenue system yet. You have activity with a dashboard attached.
Core Capabilities Behind a GTM Engineering Function
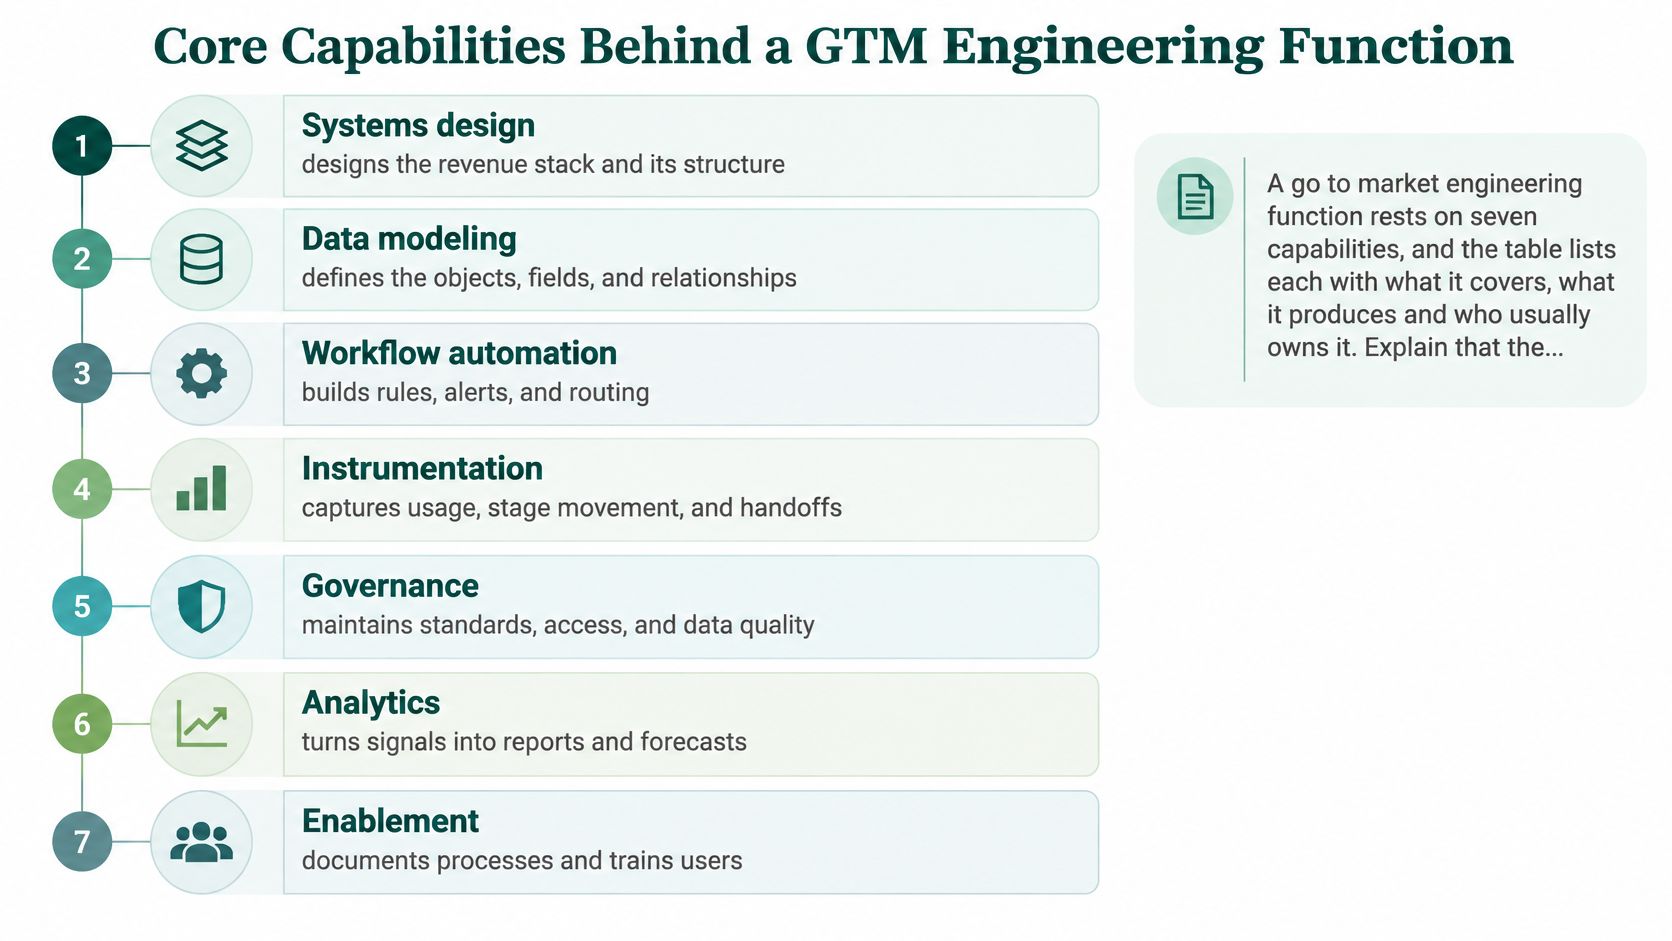
A go to market engineering function rests on seven capabilities, and they work as a stack rather than a list. The lifecycle model defines what everything below is allowed to call a stage. Data contracts move events between systems. Enrichment and routing act on individual records. Experimentation tests changes before they spread. Reporting tells you what happened, which is the layer many teams have and the only one they trust.
| Capability | What it covers | Typical output | Typical owner |
|---|---|---|---|
| Lifecycle model | Stage definitions and entry or exit rules from lead to renewal | Canonical stage dictionary | Revenue operations lead |
| Data contracts and integration | Required fields and events passed between marketing automation, CRM and product systems | Schema specification and sync monitoring | GTM engineer |
| Enrichment and deduplication | Identity matching, firmographic fill and duplicate removal | Enrichment match rate and duplicate rate | Revenue operations or data team |
| Routing and territory logic | Assigning leads and accounts to owners by segment and buying signal | Routing rules and routing-error rate | Sales operations |
| Experimentation | Controlled tests of positioning, segmentation, pricing and enablement | Experiment log with holdouts or phased rollouts | Marketing operations with a sales leader |
| Reporting and attribution | Scorecards, pipeline coverage, forecast variance and attribution | Weekly revenue scorecard | Revenue operations |
| AI-mediated discovery | Structured product facts, customer evidence and citations that AI research tools can use | Discovery audit and referral conversion tracking | Marketing leader |
How the capabilities stack
Start at the top and everything below inherits its discipline. A useful stage dictionary doesn't say "demo scheduled". It says an opportunity enters the forecast category when a budget holder has confirmed a target date and the technical approver is identified. That one sentence removes most of the argument in a forecast call, because it turns a judgment into a check.
Data contracts and enrichment decide whether the layer above can be trusted. If marketing automation passes a campaign name but not consent status, the CRM can't route on source without creating a compliance question six months later. Enrichment tells the same story from the other direction. A match rate nobody measures is a match rate nobody can defend, and a duplicate account that reaches a forecast is an error waiting to be explained in public. When you compare tools for that layer, a best data enrichment tools checklist keeps the evaluation on coverage, match rate and refresh cadence instead of brand recognition.
Routing and experimentation are where most complaints about lead quality originate. A rep who says the leads are bad is often describing a routing rule that sent a 20-person company to an enterprise account executive, or a territory rule that crossed two segments after a reorg, with nobody updating the logic. Channel breadth raises the stakes: McKinsey's global B2B research found that 72% of B2B companies selling through seven or more channels grew market share (McKinsey, the new B2B growth equation). Seven channels without shared definitions gives you seven queues, not one system.
AI-mediated discovery is the newest capability and the least mature. Its output is a discovery audit and referral conversion tracking, not a content calendar, which is a distinction worth holding on to when a vendor offers to "optimize for AI".
Ownership rarely lands in a single job title. A revenue operations lead can own the lifecycle model and the scorecard, a GTM engineer can own schema specifications and sync monitoring, sales operations normally owns routing rules, and marketing operations runs experiments with a sales leader holding the commercial half. Naming a role matters less than naming a person.
Diagnosing a problem by capability
- Forecast misses and late surprises: start with the lifecycle model and reporting, not with the reps.
- Reps calling leads poor quality: check routing and enrichment before you rewrite the pitch.
- Campaigns that generate interest but never convert: inspect the data contract between marketing automation and the CRM, then look at experimentation.
- AI tools describing the company inaccurately: the discovery capability is missing, and more content volume won't fix it.
How Systems Connect Technical Infrastructure to Revenue
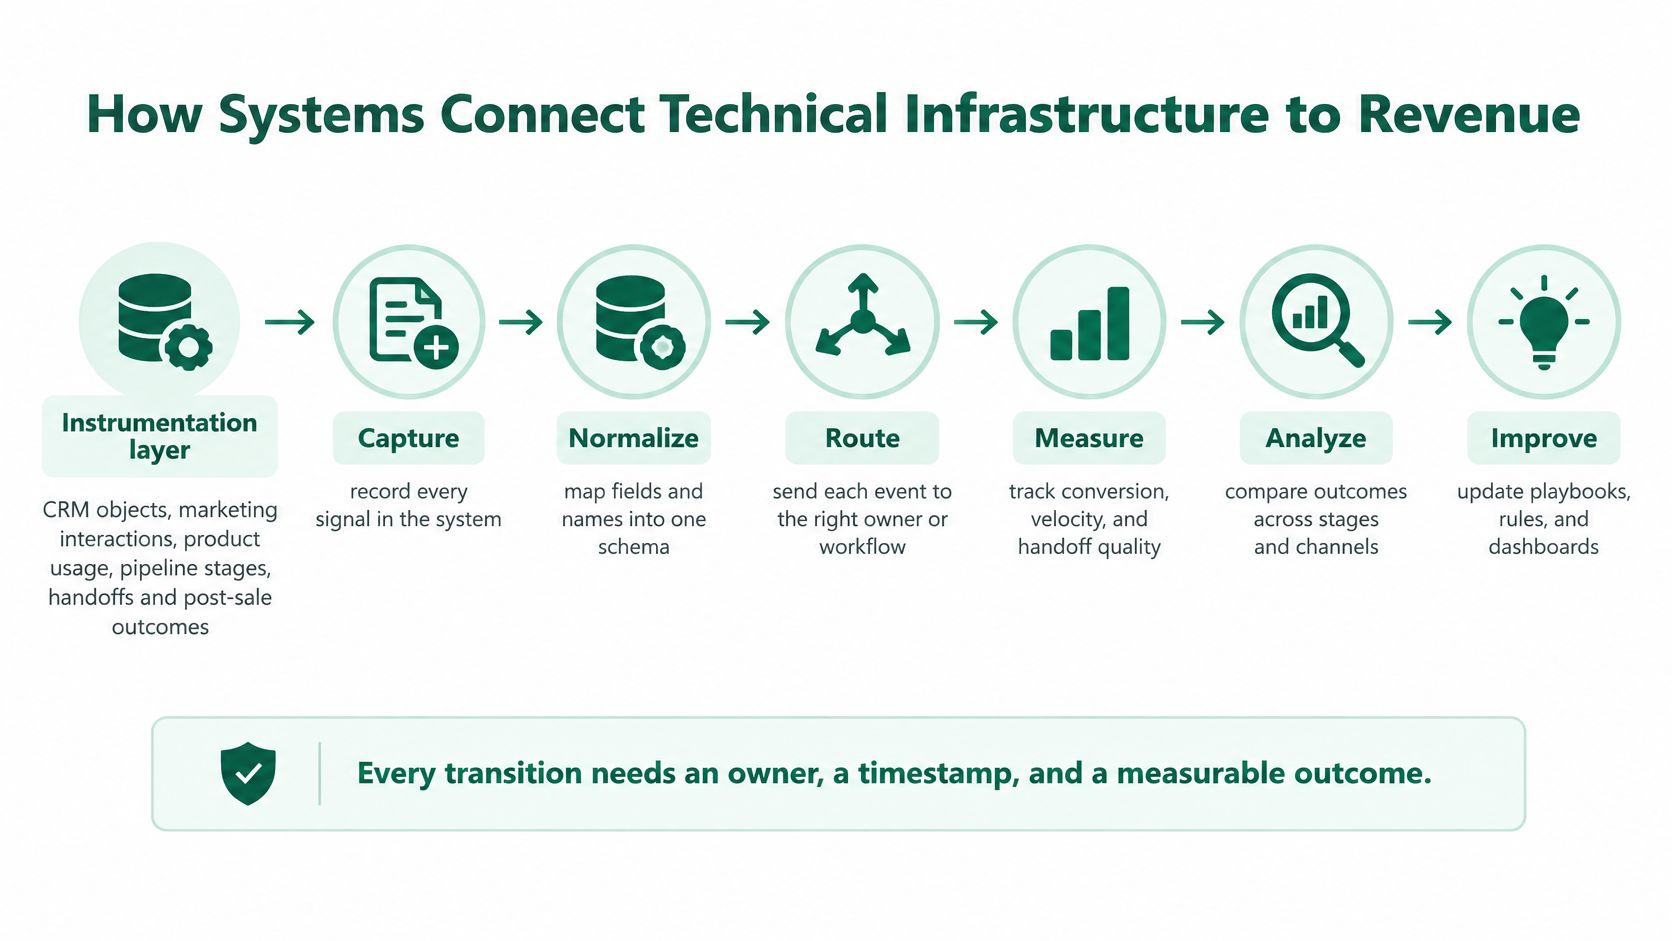
Revenue execution behaves like a delivery system once there's an instrumentation layer across CRM objects, marketing interactions, product usage, pipeline stages, handoffs and post-sale outcomes. Each of those is a transition point, and every transition point needs four things before it can be measured: an explicit event definition, an owner, a timestamp and a quality rule.
Every transition needs an owner, a timestamp and a measurable outcome. Without all three, you have an opinion about what happened.
Two examples make the rule concrete. Sales-accepted lead should mean something a system can evaluate: a named contact in a target segment, a verified work email, a stated problem that matches the offer, and an owner assigned inside the response SLA. Handoff to customer success should require fields such as the business outcome the buyer committed to, the named executive sponsor, the implementation date and any open technical risk. If a deal can close with those fields blank, the blanks get inherited by the person who has to renew it.
Data contracts keep those definitions true across tools. Marketing automation passes consented identity and campaign context into the CRM. The CRM publishes stage changes and ownership events. Product systems expose activation, usage, renewal and risk signals. Reporting preserves the original event time rather than only the latest record state, because overwriting the timestamp destroys the cycle time you were trying to measure.
The loop from engineering to revenue
The operating cycle has four steps, and skipping the last one is the most common failure.
- Instrument the transition. Define the event, its owner, its timestamp and its quality rule, then capture it at the source rather than in a spreadsheet afterward.
- Detect the bottleneck. Compare stage aging and expansion retention. A stage that holds deals twice as long as its neighbours is the place to look.
- Run a controlled process change. One change, one owner, one hypothesis, with a date it will be judged on.
- Measure downstream revenue impact. Not activity, not adoption. Pipeline created, conversion, retention and margin.
The engineering analogy is deliberate. DORA research identifies change lead time, deployment frequency, change-failure rate and recovery time as delivery measures that predict organizational performance, and it keeps returning to fast feedback and continuous improvement as the mechanism (DORA research). Revenue teams get the same effect from the loop above when they close it.
Reusable parts reduce friction in the same way they do in software: standard CRM objects, shared enrichment services, lead-scoring features, territory rules, experiment templates, reverse-ETL syncs and self-serve diagnostic dashboards. If the capture side is where you're starting, this guide to designing a lead generation system covers the path from first touch to assigned owner.
The technical risk lies in the plumbing. Integrations must be safe to retry without creating duplicates, schemas require versioning so a field rename does not break attribution unnoticed, and every sync needs monitoring for stale or missing events before a quarter's worth of reporting is built on silence. Most companies reach this point without a dedicated hire, which is why the revenue operations consultant role and when to hire one is worth understanding before you write a job description.
Where Human Judgment Must Stay in Automated Revenue Work
The default framing of this work is efficiency: fewer manual steps, more agents, shorter cycle times. That framing assumes every revenue decision can be handed to a system. In a purchase that involves several stakeholders, most of them can't.
The evidence cuts both ways, which is what makes it useful. Companies running AI-powered next-best-experience programs have reported 5–8% revenue uplift and 20–30% lower cost-to-serve ratios, according to a McKinsey report on AI in B2B sales that also finds pricing executives expect a large move toward generative and agentic AI over the next one to three years, from a much smaller base today (McKinsey, the future of B2B sales). The same report, citing Demandbase, notes that 72% of B2B purchases involve complex, multi-stakeholder buying groups, that 62% of buyers express concerns about AI complexity, and that 74% value authentic, customized engagement, transparency or collaboration.
So the question isn't whether to automate. It's which decisions a system can make alone, which need approval, and which belong to a named person who can be asked about them later.
| Revenue task | Automate | Needs approval | Human owned |
|---|---|---|---|
| Enrichment and deduplication | Yes | Overwrites of existing CRM fields | No |
| Inbound lead routing | Yes, within set rules | Rule changes and exceptions | Strategic account exceptions |
| Outreach copy drafting | Drafting yes | Before sending to named accounts | Executive and key-account messages |
| Pricing recommendations | No | Always, with margin review | Final price decision |
| Forecast adjustments | Flagging only | Any change to stage data | Commit call |
| Renewal risk alerts | Alerting yes | Before any customer contact | Owner decides the response |
| Multi-stakeholder deal strategy | No | Not applicable | Yes |
Three thresholds that set the answer
Reversible and cheap decisions get automated. Enrichment, deduplication, alerting and drafting all fail in ways you can undo in an afternoon.
Decisions that move money or customer terms need approval. Pricing, discounting, contract language and renewal concessions get a second pair of eyes even when the recommendation arrives pre-written.
Decisions that carry relationship or trust stay human. Deal strategy across a buying committee, executive outreach, and the judgment call on whether an account is at risk are moments where the buyer is evaluating a person, not a model.
What governance looks like in practice
Audit logs on automated field changes and outbound sends, so you can reconstruct what the system did and when. Named review points before anything reaches a customer. Experiment design with holdouts or phased rollouts, so you can separate the automation's effect from a good quarter. And a metric set that includes win rate, cycle time, margin, adoption and customer trust, because volume alone will always look impressive.
The test for any new automation: what happens when it's wrong, who can reverse it, and how quickly would the team notice? If any of the three has no clear answer, the thing isn't ready to run unsupervised.
Go to Market Engineering in Practice
Two worked examples follow, both composites rather than named clients. The fixes are unglamorous, and that is the point: each one changes the system around the team rather than asking the team to try harder.
Case one, a forecast nobody believes
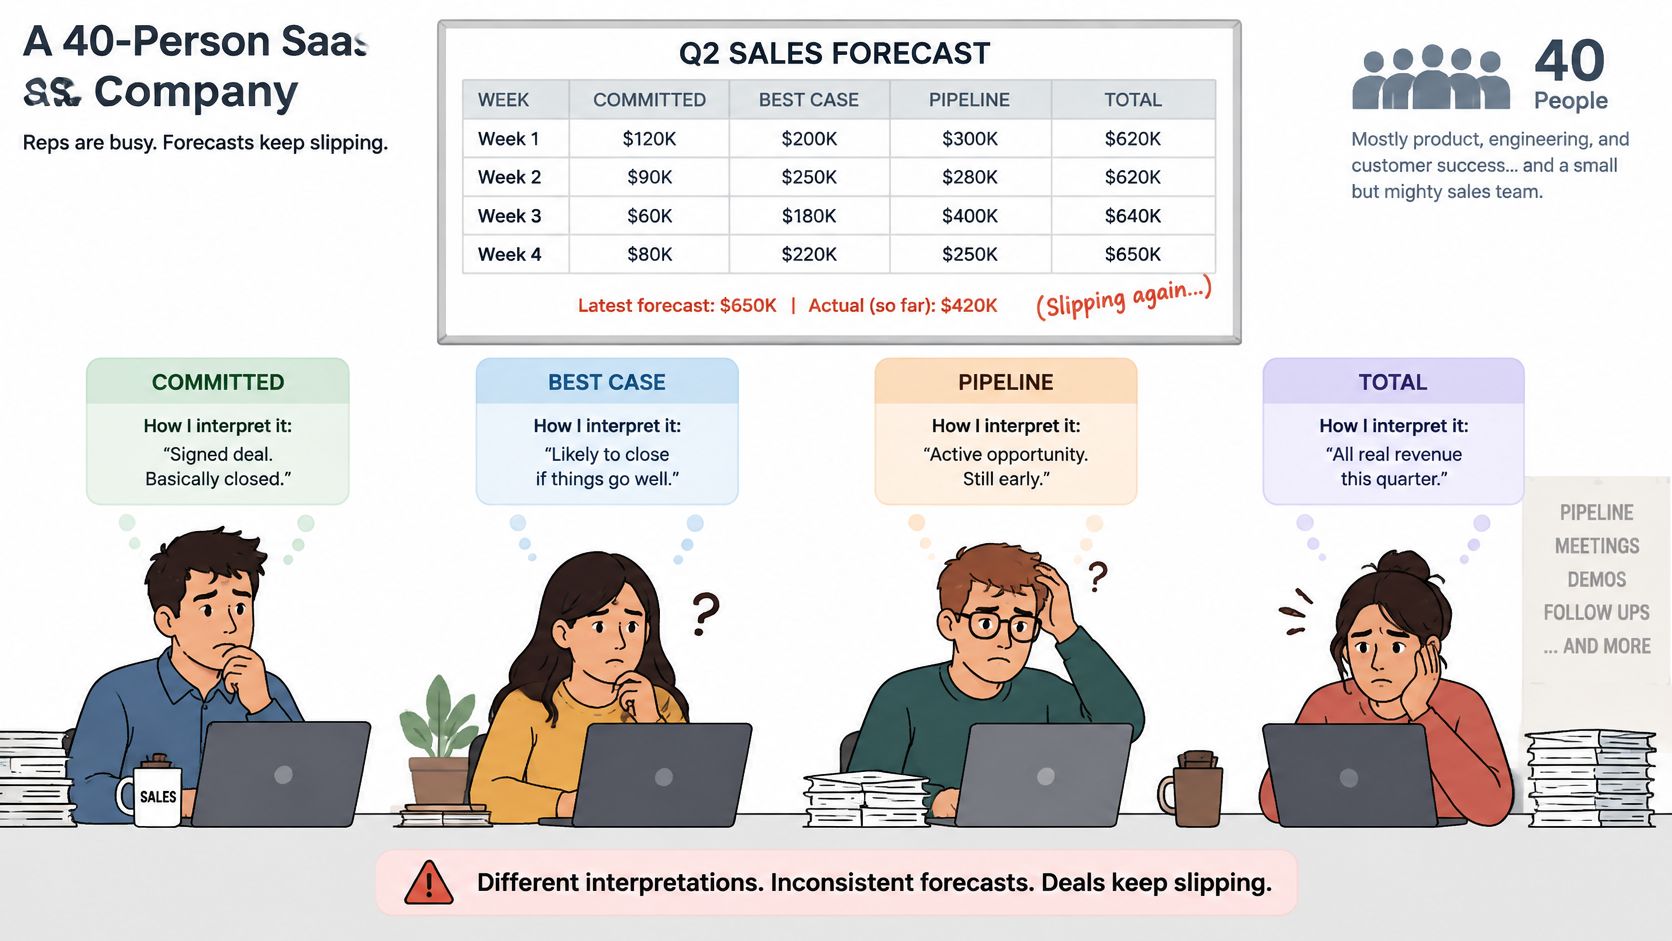
A 40-person SaaS company has busy reps and a forecast that keeps slipping. Before the change, each rep defines the forecast category differently. One treats a verbal "this looks great" as commit. Another holds everything at pipeline until a signed order form lands. The aggregate is a blend of optimism and pessimism with no way to separate them, so the forecast call becomes a test of who argues most convincingly.
In software terms, the stage field is an interface with no contract. It accepts any value the writer prefers, while downstream readers, the board, finance, the hiring plan, consume it as if it were validated data.
The diagnosis produces three fixes, in order. First, one stage dictionary that states the entry and exit rule for every stage. Second, required fields that must be populated before anyone changes a forecast category, enforced in the CRM rather than requested in a meeting. Third, a weekly scorecard with a handful of metrics reviewed against one defined change.
After the change, forecast variance narrows and late misses become rare, because the definition of commit stopped depending on the rep.
Case two, buyers who arrive already briefed
A second company has thin product pages and a competent sales team. Buyers start their research in an AI assistant, get a summary of the category, and arrive on a call already holding opinions the company never published. Forrester reports that 94% of business buyers used AI in their buying process in its 2025 survey, and that twice as many buyers considered generative AI or conversational search a meaningful information source compared with any other source, including vendor websites and salespeople (Forrester on B2B buyers and zero-click buying).
Those buyers also cross-check. An AI summary is treated as a draft, and the claims that survive are the ones a buyer can confirm against material the company controls: documentation, customer evidence, third-party coverage. An assistant assembles its answer from citable chunks of text, so the practical question is which chunks of yours it can find and repeat accurately.
The response is a set of artifacts. Structured product facts an AI tool can read and repeat accurately. Customer evidence with names and outcomes. Third-party validation. Technical documentation in crawlable form. A conversion path built for a visitor who arrives after an AI recommendation rather than after a search result.
Measurement changes too. Branded mentions, citation frequency, qualified visits and conversion after an AI referral give a more honest view of discovery than a keyword report.
The shared lesson across both cases is that the fix sits in the system between tools and people. The scorecard, the stage dictionary and the evidence library all live in the parts of a GTM playbook that most companies skip in favour of buying another platform. It is also work a fractional operator can carry: in an 18-month engagement, BuildingLink, a B2B PropTech SaaS company replacing its former VP Sales, scaled ARR from $18M to $25M.
Metrics That Show Whether the System Works
Emails sent, calls made and dashboards created are weak primary measures, because they can rise while data quality, buyer relevance and conversion fall. A team can look more productive in the exact quarter its pipeline is degrading. Pair every throughput measure with a stability measure.
| Metric | Type | Healthy signal | Warning sign |
|---|---|---|---|
| Lead-to-opportunity conversion | Throughput | Stable or rising after routing changes | Falling while activity rises |
| Stage aging | Throughput | Shrinking time in each stage | Deals stuck beyond stage norms |
| Win rate by segment | Outcome | Stable or rising in target segments | Drop concentrated in one segment |
| Pipeline coverage | Throughput | Coverage holds against the forecast target | Coverage falls below plan |
| Forecast variance | Stability | Gap between forecast and actuals narrows | Repeated late misses |
| Duplicate rate | Stability | Low and falling | Rising after new integrations |
| Required-field compliance | Stability | Rising toward full compliance | Missing fields at handoff |
| Time from intent signal to assigned owner | Speed | Shrinking | Growing delays in routing |
| Enrichment match rate | Stability | Rising | Falling after a source change |
| Routing-error rate | Stability | Low and stable | Rising after rule changes |
| Revenue per qualified account | Outcome | Rising in target segments | Falling while qualified volume grows |
Speed and quality benchmarks
Three measures catch most problems early. Time from intent signal to assigned owner shows whether routing responds to interest or waits for a batch job. Time from qualification to first action shows whether an accepted lead is worked. Share of records meeting required-field rules shows whether the data feeding every other number is complete enough to trust. You don't need a target invented by a consultant; you need a direction and a weekly reading.
Reuse compounds, and the delivery world has measured it. DORA's 2024 report found that organizations using internal developer platforms reported 8% higher individual productivity, 10% higher team performance, and a 6% increase in software-delivery performance (2024 DORA report). The revenue equivalent is a governed set of shared components, which is why a scorecard should track the health of the plumbing alongside the output.
Proving a change caused the result
Correlation is easy to find in a quarter and hard to defend a year later. Judge an automation with holdouts, phased rollouts or matched cohorts, and write down the expected effect before you ship it. One change at a time, one owner, one date.
The weekly habit matters more than the metric list. Choose five to seven measures from the table, review them every week against one defined change, and retire anything nobody acts on. A longer list reviewed monthly is a decoration. For a deeper look at how these measures fit a revenue operations practice, this piece on the power of metrics from a RevOps perspective covers the reporting discipline behind the scorecard.
Confirm Your Starting Point Before You Build
The decision isn't whether to build the discipline. It's whether to build it in-house, bring in a fractional leader, or fix the single gap that's distorting everything else first. Getting that order wrong costs a quarter, and usually more.
Five warning signs
- Forecasts miss at the last minute rather than drifting early, which points at stage definitions rather than at rep effort.
- Two reps define the same stage differently, so the pipeline total is a negotiation.
- Reps spend the first hour of the day reconciling data across the CRM, a spreadsheet and a sequencing tool.
- Marketing and sales disagree about lead quality without either side able to produce evidence.
- AI research tools describe the company inaccurately, which means the discovery layer is missing from the stack.
Two or more means the system is the problem, not the people running it.
Confirming the diagnosis yourself
You can run the checks without outside help. Use the scorecard from the previous section and compare four things: pipeline health by stage, stage definitions across reps, handoff completeness into customer success, and the tool stack itself. Then look for the single broken definition sitting upstream of the others. One ambiguous stage can inflate conversion, hide aging and make forecast variance look like a performance problem when it's a naming problem. Fix the gap that produces the most warning signs first, because stage definitions touch every metric downstream.
Fractional support is one option among several, and it should be judged on the same criteria as an in-house build: industry experience, fit for your stage, and whether it leaves a working scorecard behind. Revenue Nomad's How It Works process runs in three steps, matching, discovery, and sales execution. The discovery step includes a pipeline health assessment, team performance analysis, sales process evaluation, and technology stack review, and matching checks industry expertise match, cultural fit, stage-appropriate experience, and goal alignment.
This week: write one stage dictionary, agree its definitions with both sales and marketing, and pick the single metric the team will review every week from now on. Everything else can wait until that exists.
When the system is the problem, the fastest route is an operator who has built one before. Revenue Nomad matches companies with fractional sales, marketing and revenue operations leaders whose work history, engagement records and reviews are visible before you request an introduction, which matters when the first job is diagnosing stage definitions, routing and reporting rather than adding another tool. Browse the operator directory at Revenue Nomad and start with a scoped engagement around the one gap that's costing you the most.